The following work of mine is inspired by Guppy Multiple Moving Average (GMMA). However, I've tweaked it, over time to suit my trading style. Still, I think a lot needs to be done to make it even better than its present form.
Before going further, let me give you a brief outline about GMMA. The following is taken from Investopedia:
DEFINITION of 'Guppy Multiple Moving Average - GMMA'
An indicator used in technical analysis to identify changing trends. The technique consists of combining two groups of moving averages with different time periods.
One set of moving averages in the Guppy multiple moving average (GMMA) has a relatively brief time frame and is used to determine the activity of short-term traders. The number of days used in the set of short-term averages is usually 3, 5, 8, 10, 12 or 15.
The other group of averages is created with extended time periods and is used to gauge the activity of long-term investors. The long-term averages usually use periods of 30, 35, 40, 45, 50 or 60 days.
Read more here: Guppy Multiple Moving Average (GMMA)
While being sure, there is NO HOLY GRAIL out there, I try an make an attempt to close the gap.
In my setup, I use in all 6 moving averages, 3 belong to the short duration, coloured BLUE (they change red as trend changes for downside) and other 3 belong to the longer time frame (TF) coloured Green.
Together as constructed, I call them Raja Ribbon.
Short TF ribbon: These are players having a trading outlook.
Long TF Ribbon: These are players who are on the investing side of the game.
Nope, I don't use the BUNCH of short and long TF like in GMMA.
Nope, I don't use Exponential Moving Average (EMA) like in GMMA.
I use simple trendlines, not on price but on the ribbon.
I look for Caps and Bowl, more so when both ribbons are getting together, namely traders and investors.
People with trading mentality ALWAYS lead the trend, however, it gets the seal of being a secular one once those with investing mindset joins them and they are in the union.
Raja Ribbon tries to denote the sentiments in an easy visual form.
I use this setup mainly on Weekly TF, in order to find an almost definite change in the trend of the instrument. Like I said, there is NO Holy Grail, therefore one needs to apply a very important and prominent indicator, unfortunately not present in any charting software, named Common Sense.
What I look for in the setup?
I use trendlines on short TF's ribbon also keep in consideration the placement of short TF ribbon in context of longer TF ribbon. Both the ribbons need to be taken as a whole and not in singular fashion.
Here is an example of TATA Motors from July 2013 till present.
ONGC

Tata Steel

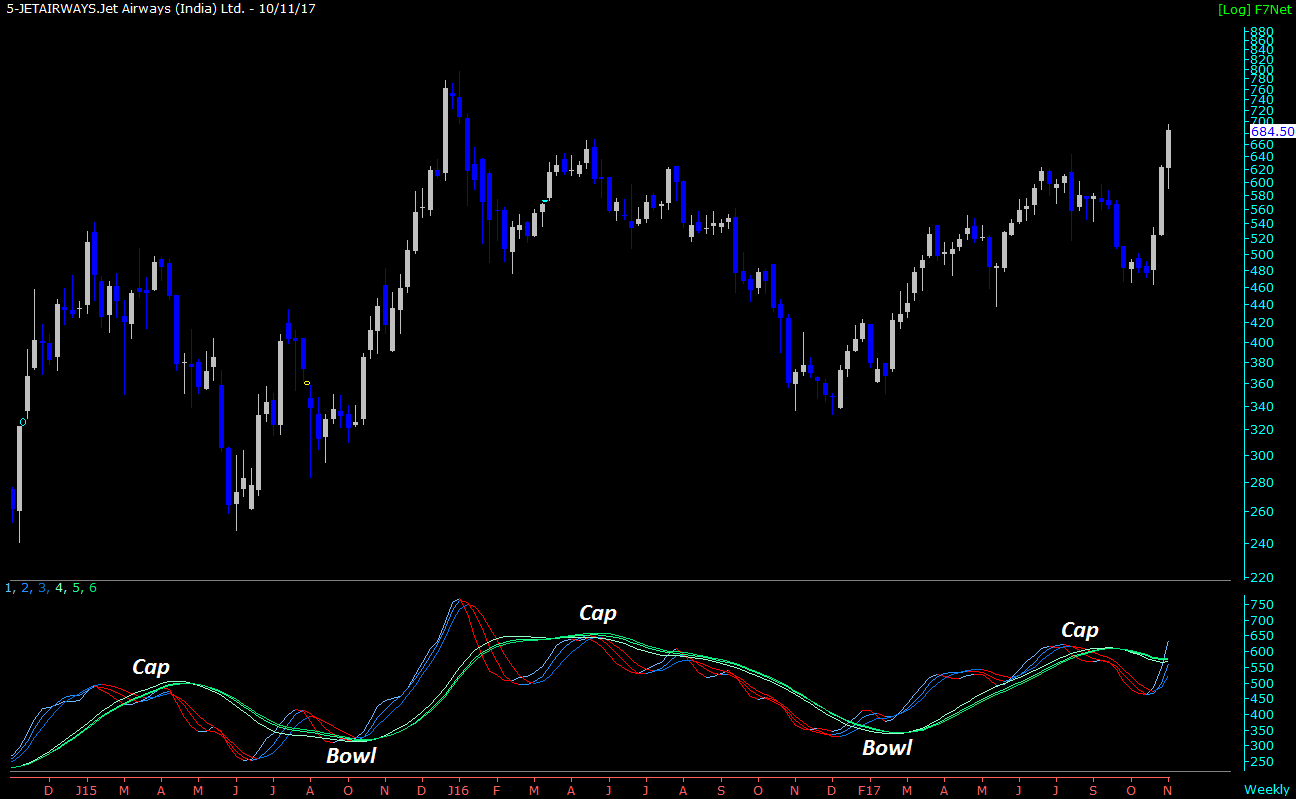
Jet Airways
Nope, it's not a fool-proof setup. It has its shortcomings, like any other system based on moving averages, which tends to fail during the sideways market conditions, BUT to reduce the failure rate, I don't use EMA.
The setup DOES meet its goal of finding quite a possible trend reversal in the instrument on a medium to long-term TF.
I am still working on it, hopefully soon, shall have better results.
Thank you